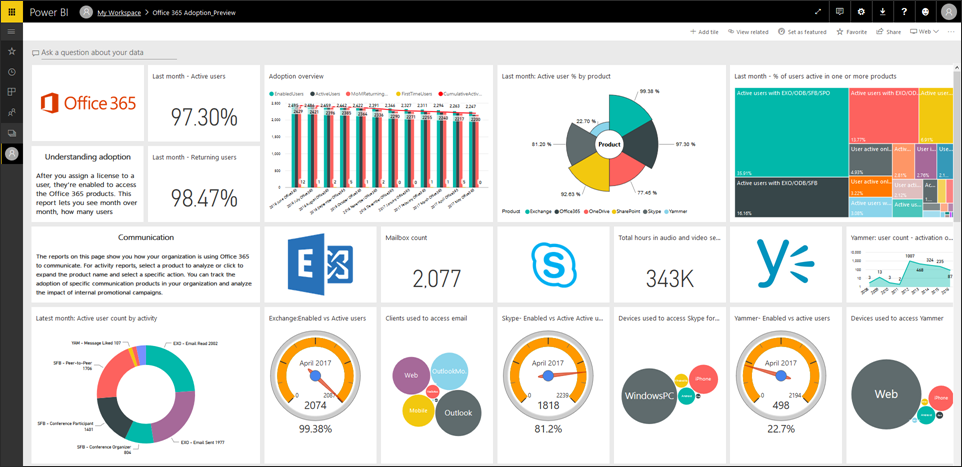
 Microsoft recently announced an Office 365 adoption content pack for Power Bi. This content pack can be used to create a Power BI dashboard to help Office 365 administrators understand how their users interact with Office 365, by tracking usage and collaboration across apps.
Tracking app usage in Office 365 isn’t new but putting the information into a Power BI dashboard makes it much easier to see and interact with the data so you can use it to make decisions. Two of the best uses for this data are to guide your user training and to determine if your users are in the right licenses.
Some of the most valuable data in the dashboard shows you activation (refers to just activating products – see specific definitions of “active user” by app here and adoption (refers to actively using the product). Using this information can help you take steps to make sure you’re getting the best return on your investment.
If your users consistently aren’t using apps, first determine why. Is it because they just don’t know how to use it? Is it because they don’t want to change what they are already doing, even if it’s less efficient? Or is it because that app just doesn’t add any value?
Guided Training
One mistakes a lot of companies make when moving to Office 365 is assuming they don’t need to do any user training since most people are already familiar with Office products like Outlook and Word. But most Office 365 plans offer a lot more than just traditional Office products.
If your users aren’t actively using apps because they don’t know how to use them, it may be time for some targeted training. You can drill down deeper into the data to get more information about the best way to go about this. If you’re tracking by user, check the inactive users – is there a common thread (same department, same location, etc.)? If so, you can tailor the training to whatever that may be.
Another mistake we see companies make with Office 365 is not changing their business processes. Picking up an inefficient process and putting it in Office 365 without making any changes isn’t going to change anything. Seeing what apps people are and are not using could help give insight into where there is potential to make a business process more efficient.
The dashboard also shows you who your power users are. These people are going to be your best advocates for refining business process and can potentially help bring late adopters on board. You can also use insight from these users to create customized training to fit your organizational needs.
Save money by switching licenses
When you first move to Office 365, it can be difficult to figure out which plan (or a combination of plans) is best for your company. When you factor in the different plans and available add-ons, there are dozens of options. Some companies just end up picking one of the more popular plans and giving it to everyone.
While that way does make it a little easier to get started, it can be a waste of money if your users don’t need everything their plan includes. The information in the dashboard can also help you determine if your users are in the right plans and act accordingly.
If users don’t use a particular app(s) and it’s not due to lack of training, you may be able to switch them to a lower level plan without affecting their performance. If you have any apps that only a few people use, you can potentially switch everyone to a lower plan and get that program as an add-on for select users.
How to get it
Sign up for Power BI with your Office 365 admin credentials (it’s free). It may already be included in your Office 365 license. Then, follow these directions for activating the content pack and enabling the dashboard in Power BI.
Once you have the dashboard set up, you can make customizations as needed. Microsoft has support articles with more details about how to interact with the dashboard to drill down data and how to customize the dashboard to fit your needs.


